Abstract
Photovoltaic (PV) systems allow us to tap into all abundant solar energy, however they require regular maintenance for high efficiency and to prevent degradation. Traditional manual health check, using Electroluminescence (EL) imaging, is expensive and logistically challenging which makes automated defect detection essential. Current automation approaches require extensive manual expert labeling, which is time-consuming, expensive, and prone to errors. We propose PV-S3 (Photovoltaic-Semi-supervised Semantic Segmentation), a Semi-Supervised Learning approach for semantic segmentation of defects in EL images that reduces reliance on extensive labeling. PV-S3 is an artificial intelligence (AI) model trained using a few labeled images along with numerous unlabeled images. We introduce a novel Semi Cross-Entropy loss function to deal with class imbalance. We evaluate PV-S3 on multiple datasets and demonstrate its effectiveness and adaptability. With merely 20% labeled samples, we achieve an absolute improvement of 9.7% in mean Intersection-over-Union (mIoU), 13.5% in Precision, 29.15% in Recall, and 20.42% in F1-Score over prior state-of-the-art supervised method (which uses 100% labeled samples) on University of Central Florida-Electroluminescence (UCF-EL) dataset (largest dataset available for semantic segmentation of EL images) showing improvement in performance while reducing the annotation costs by 80%.
Proposed Approach
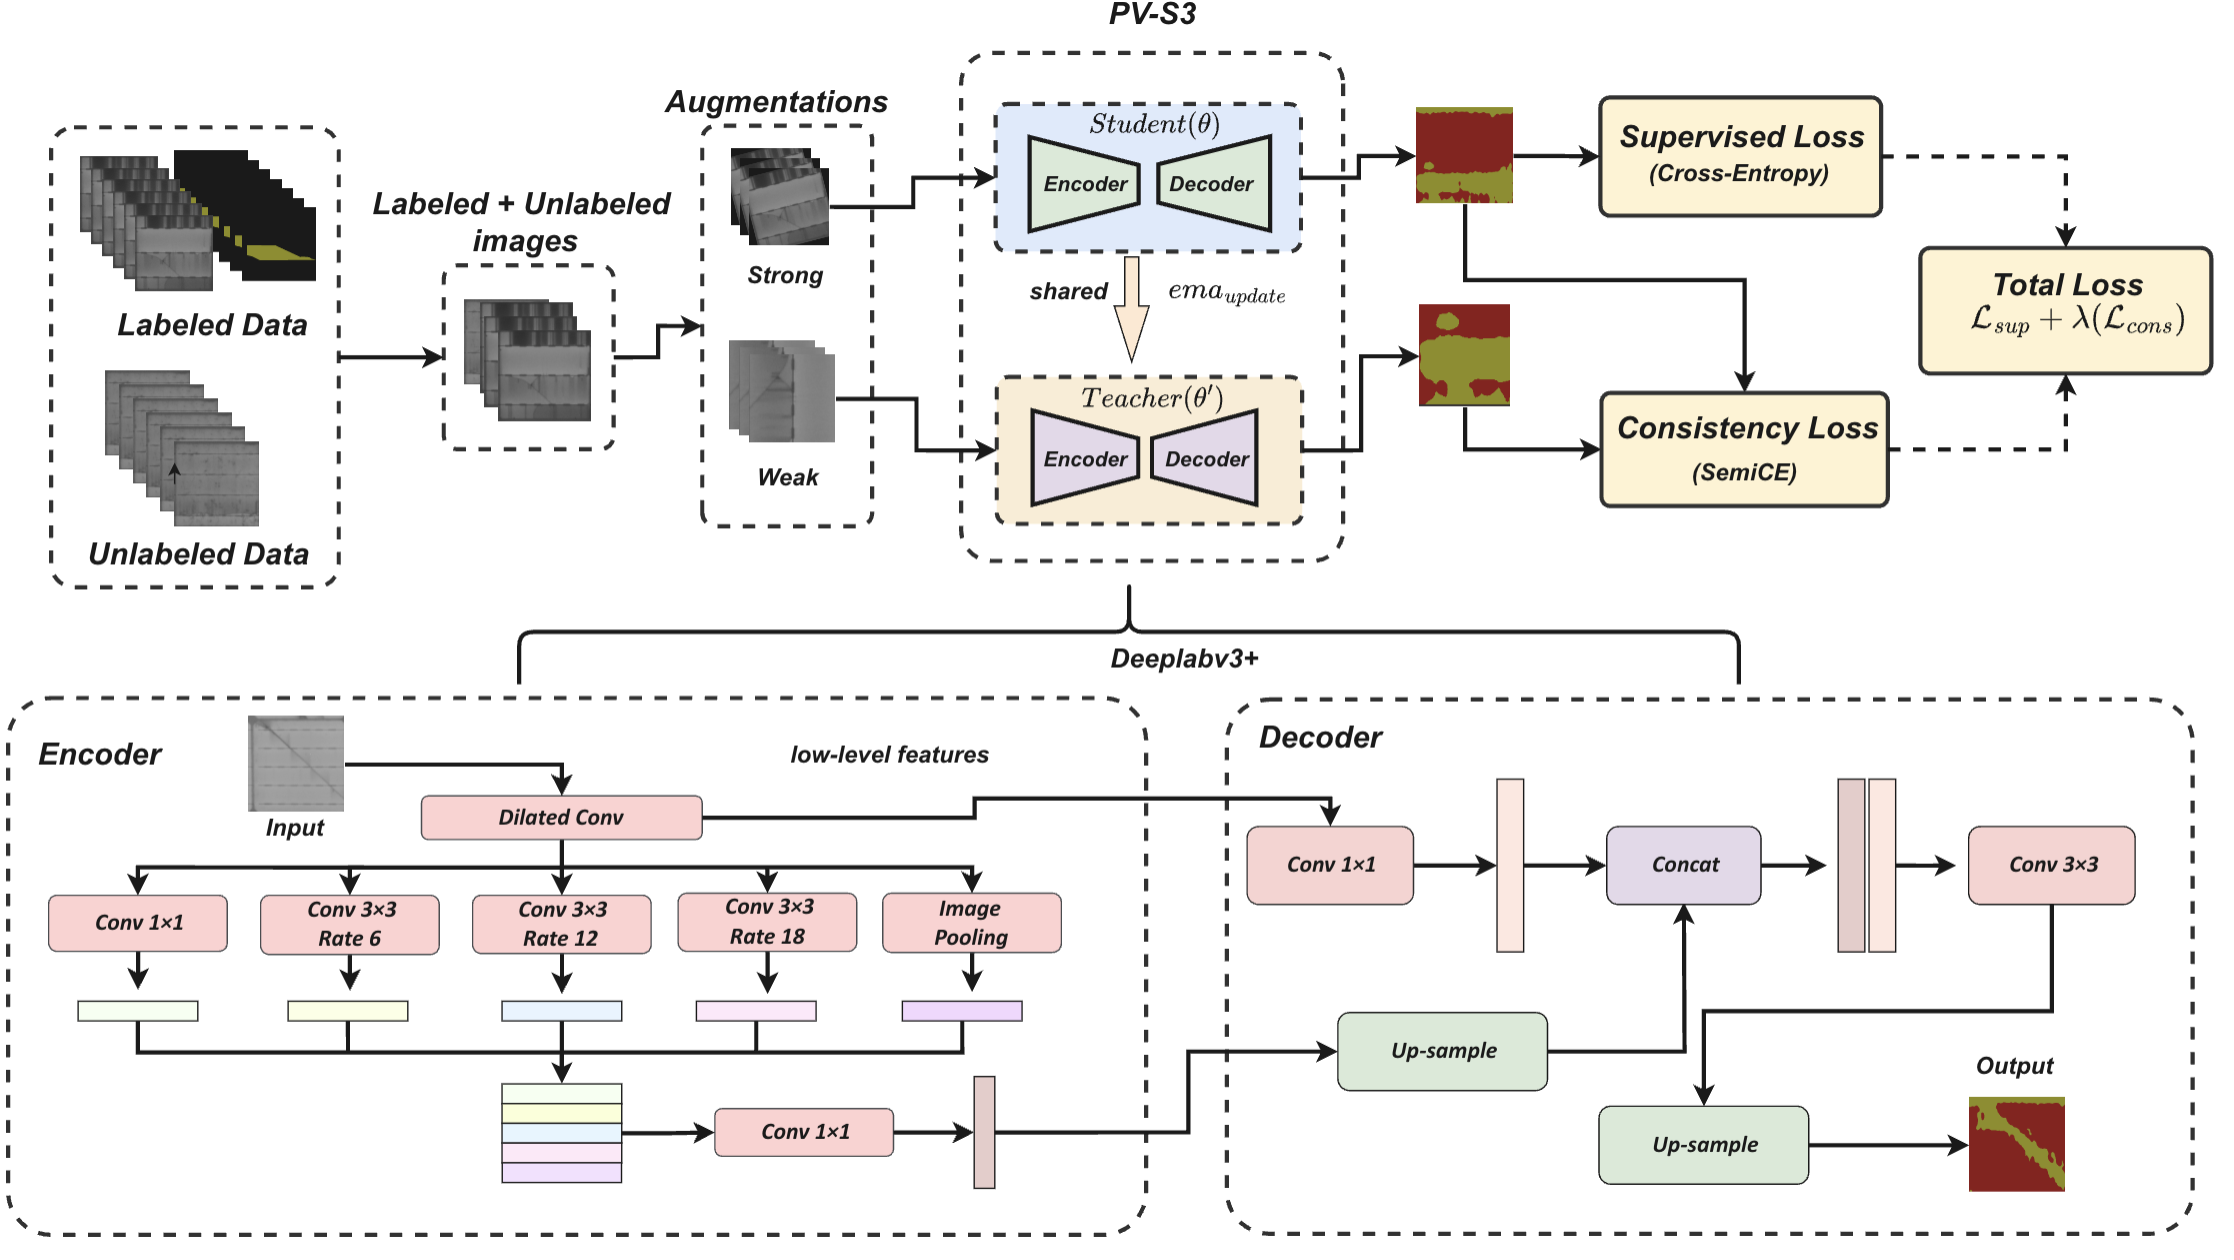
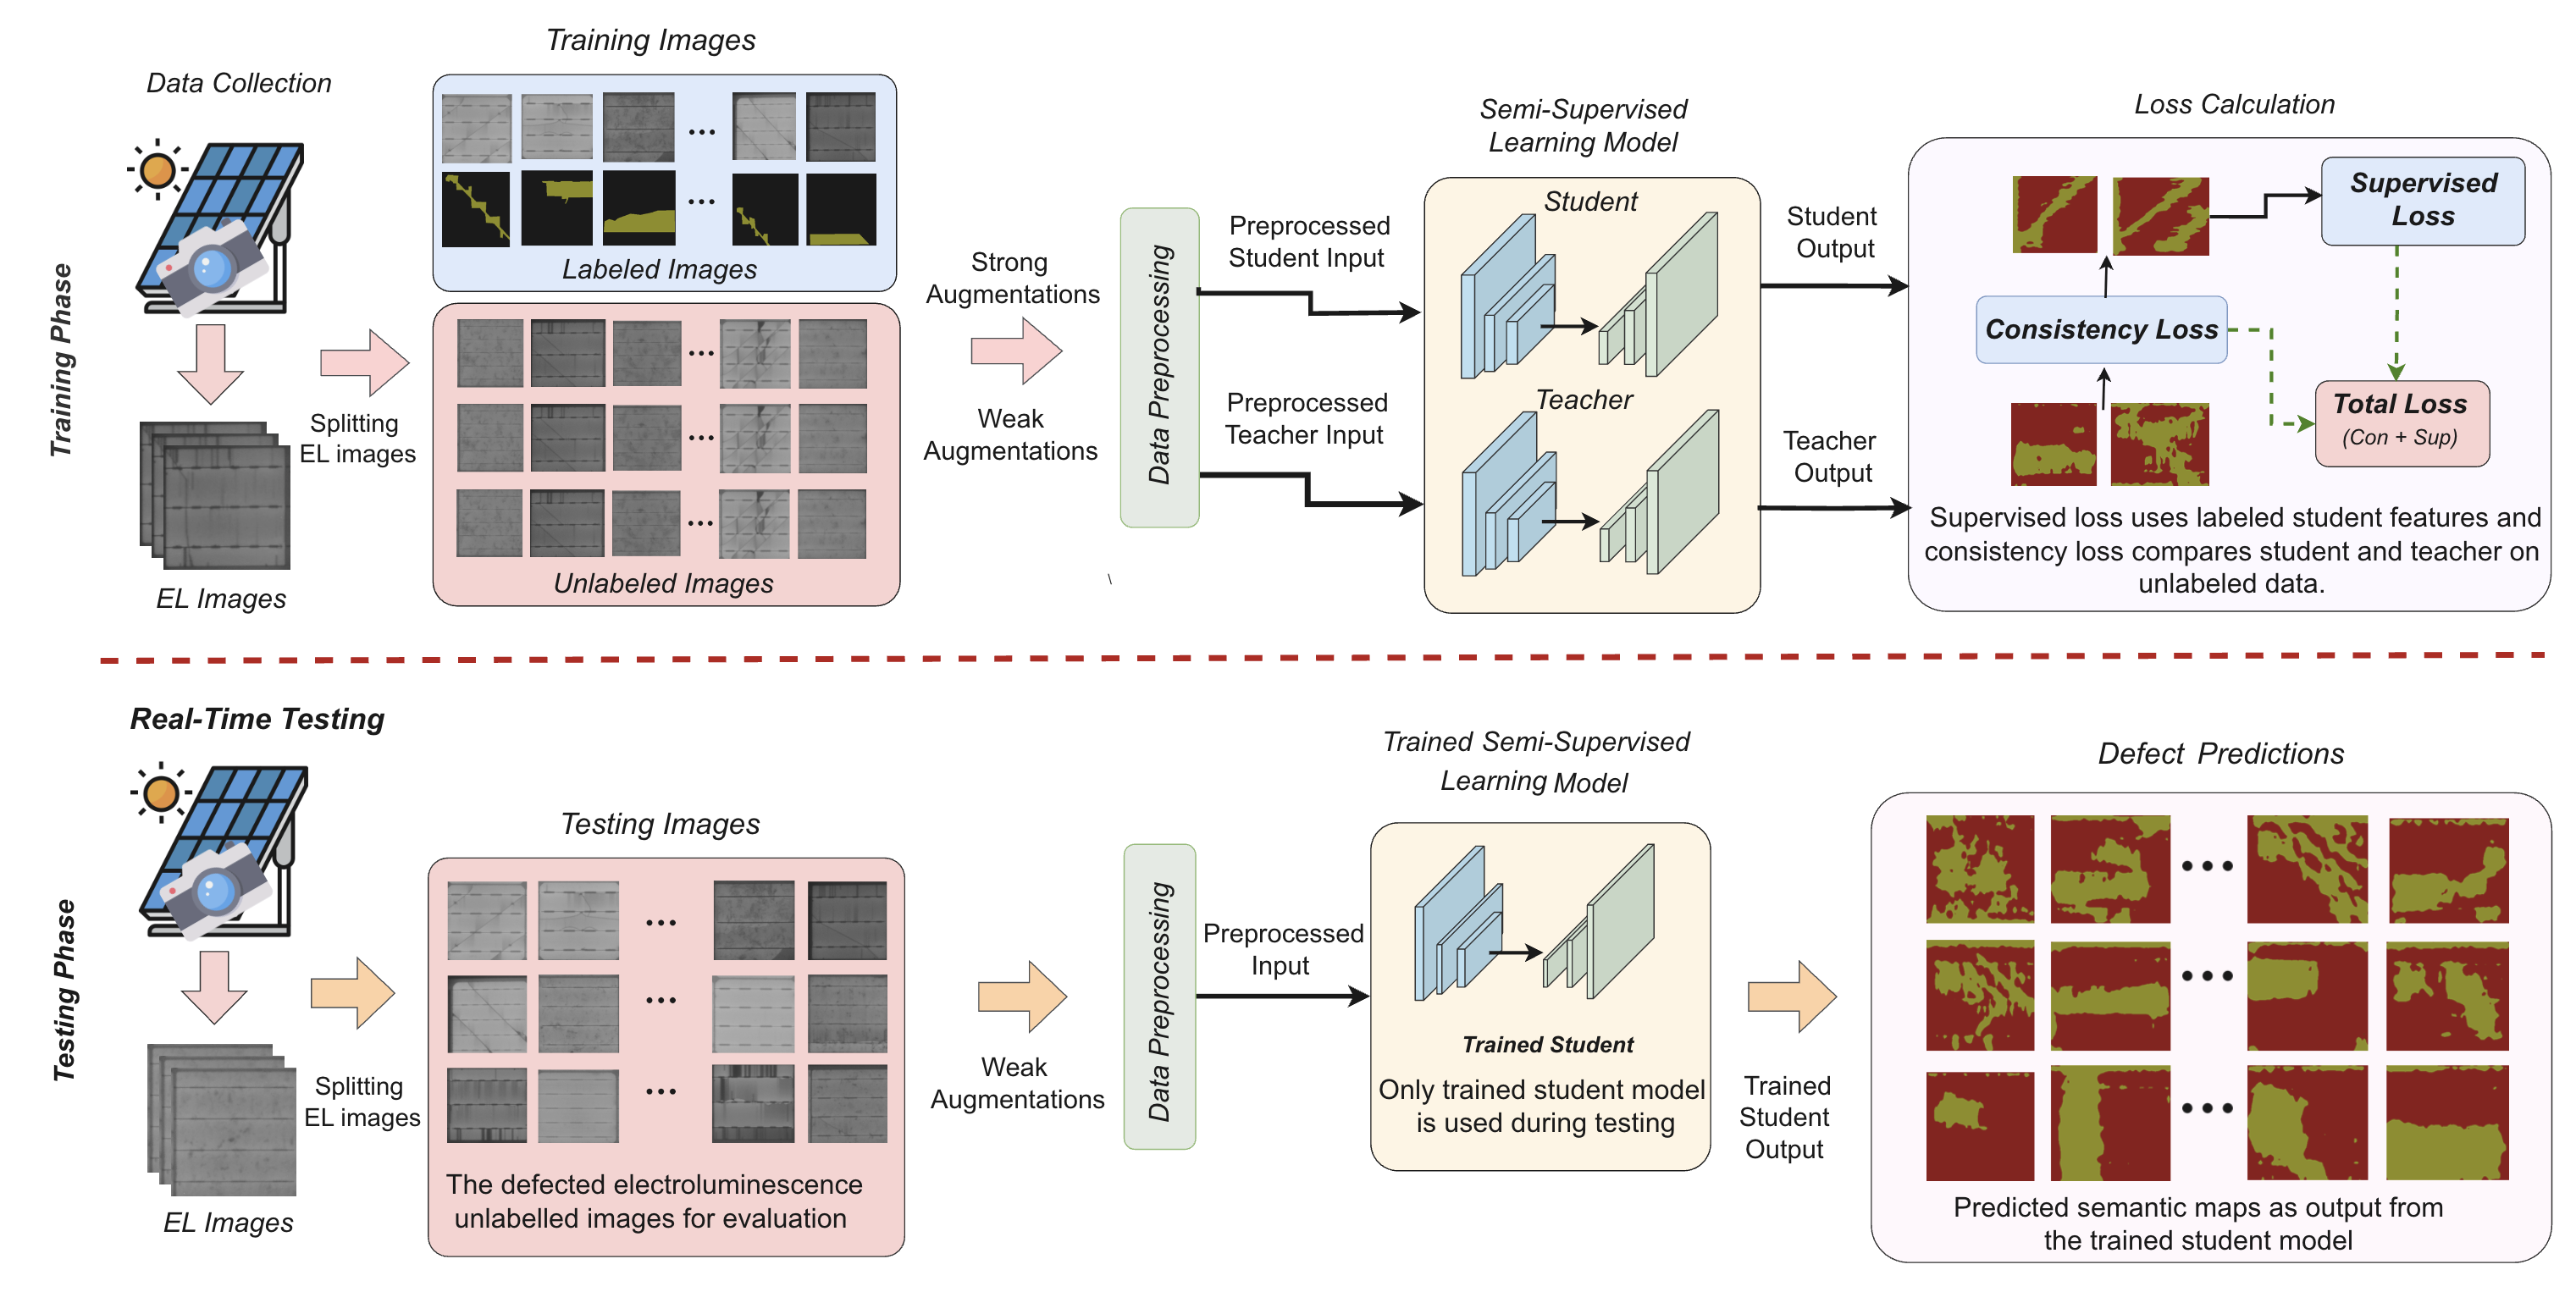
We propose PV-S3 (Photovoltaic-Semi Supervised Semantic Segmentation), a semi-supervised deep learning framework for semantic segmentation in PV module defect detection, which efficiently utilize both labeled and unlabeled EL images. PV-S3 reduces the reliance on extensive labeled data while addressing the scalability issues in large-scale solar installations. It is based on mean-teacher approach and efficiently leverages unlabeled data. The proposed method enhances model accuracy and generalization by enforcing consistency between the predictions of a student model and a temporally averaged teacher model. Such an approach is crucial for reducing reliance on extensive labeled datasets, addressing a key challenge in the semantic segmentation of PV module defects. To the best of our knowledge there is no current existing work in Photovoltaics making use of semi-supervised learning approaches or reduced labeled data for defect detection.
Datasets
We use the UCF-EL Defect Dataset, which includes nine distinct defect types, each with specific EL patterns and locations on the cell surface, such as cracks, grid interruptions, and corrosion. The dataset also consists of images which are healthy and contain no defects. The ground truth segmentation map for these images has a pixel index same as the background.
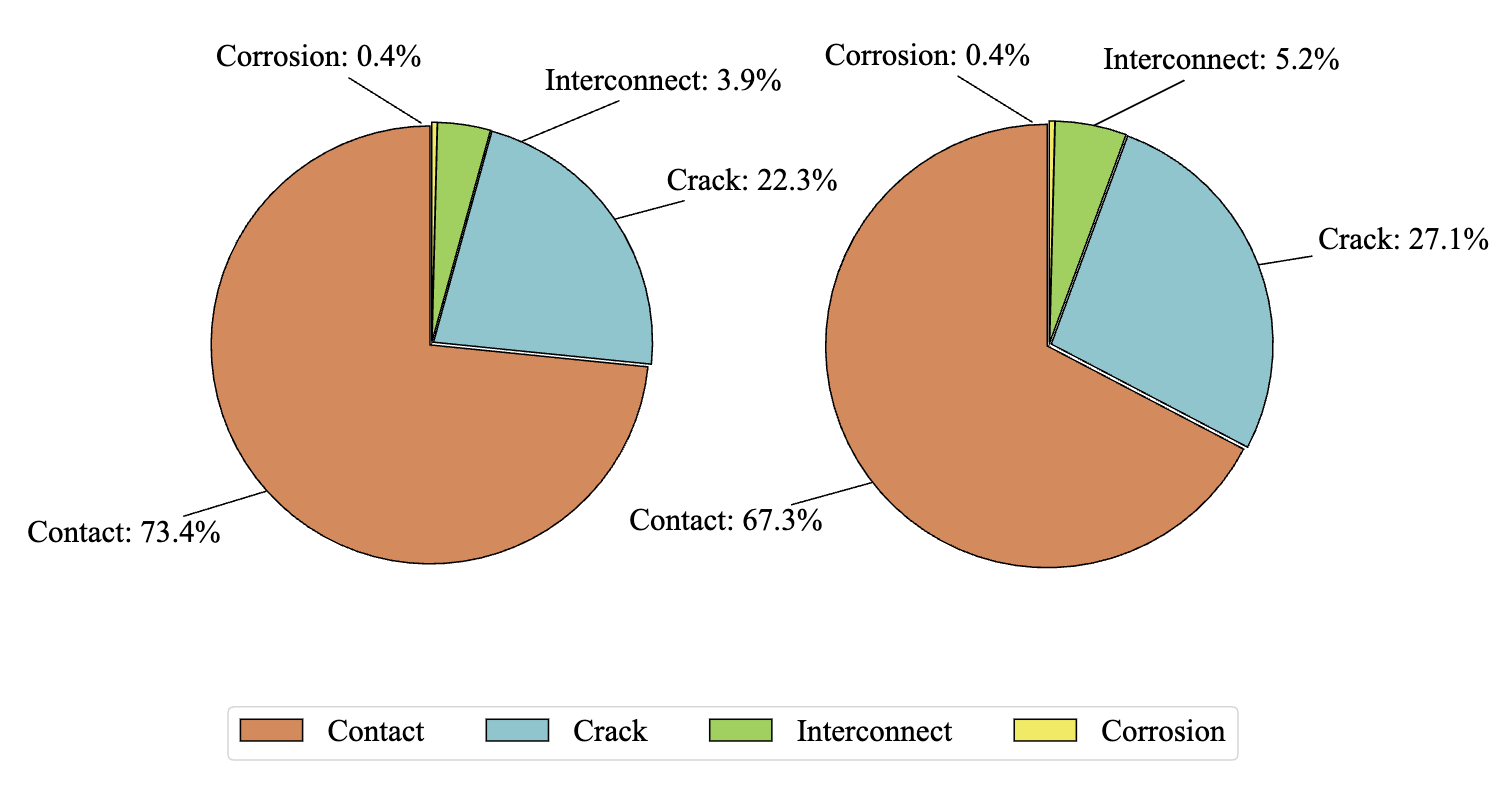
The pie chart on the left illustrates the distribution of the four defect classes based on the number of images containing each defect class, indicating how frequently each type of defect appears in the dataset at the image level. In contrast, the pie chart on the right shows the pixel-wise distribution of defects, detailing the proportion of pixels occupied by each defect class across all images. This comparison highlights the difference between the occurrence of defects in images and their actual spatial extent within the dataset.
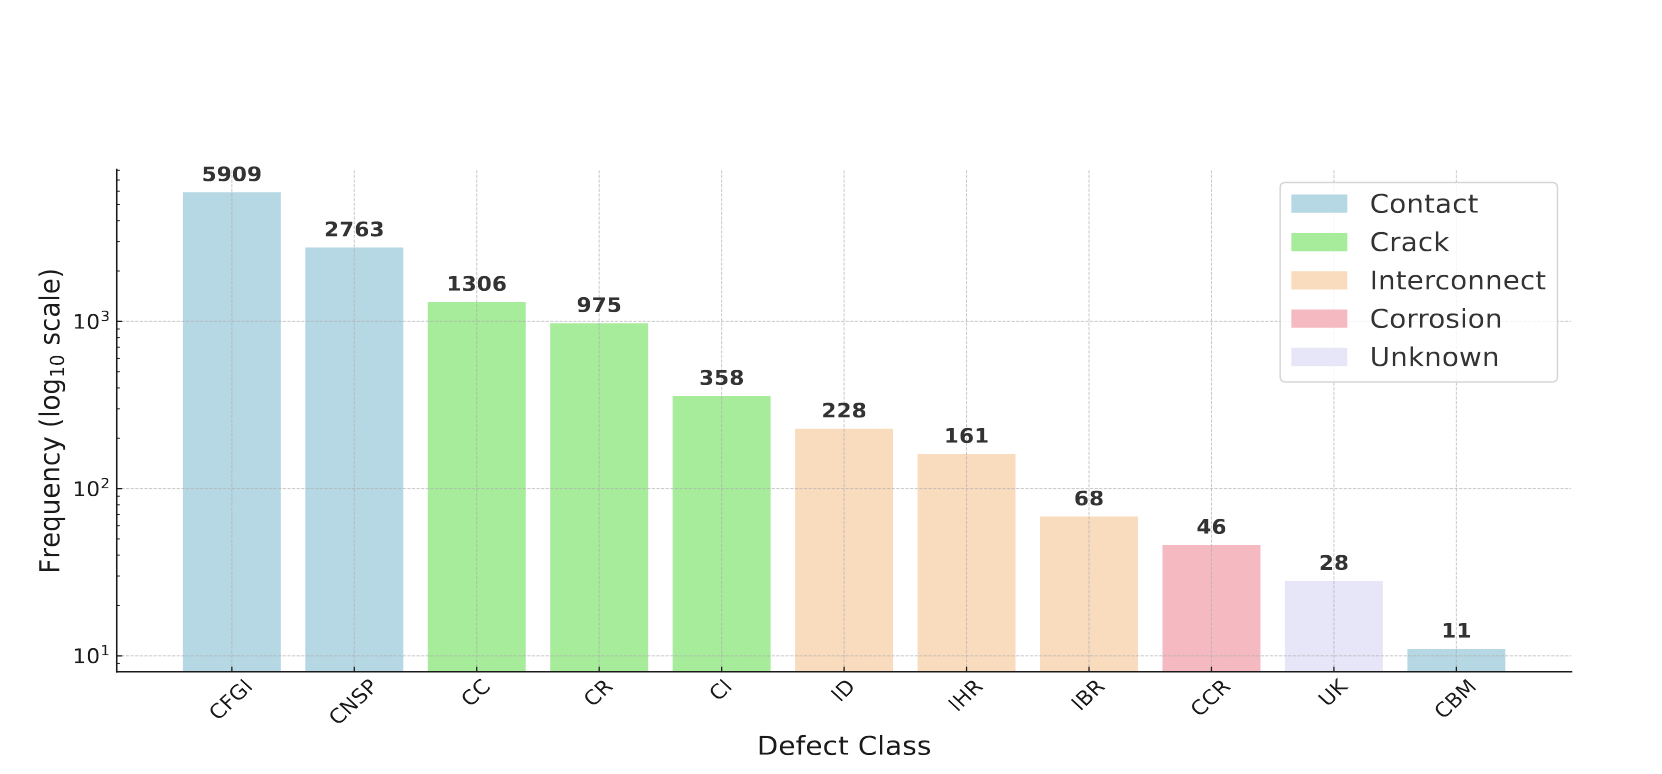
Each defect is denoted by an abbreviation for clarity. “CNSP” represents Contact Near Solder Pad, “CR” stands for Crack Resistive, “CFGI” is Contact Front Grid Interruption, “CC” denotes Crack Closed, “CI” indicates Crack Isolated, “IHR” means Interconnect Highly Resistive, “IBR” stands for Interconnect Bright Spot, “CCR” is Contact Corrosion, “UK” signifies Unknown defects, “CBM”represents Contact Belt Marks, and “ID” denotes Interconnect Disconnected.
Results
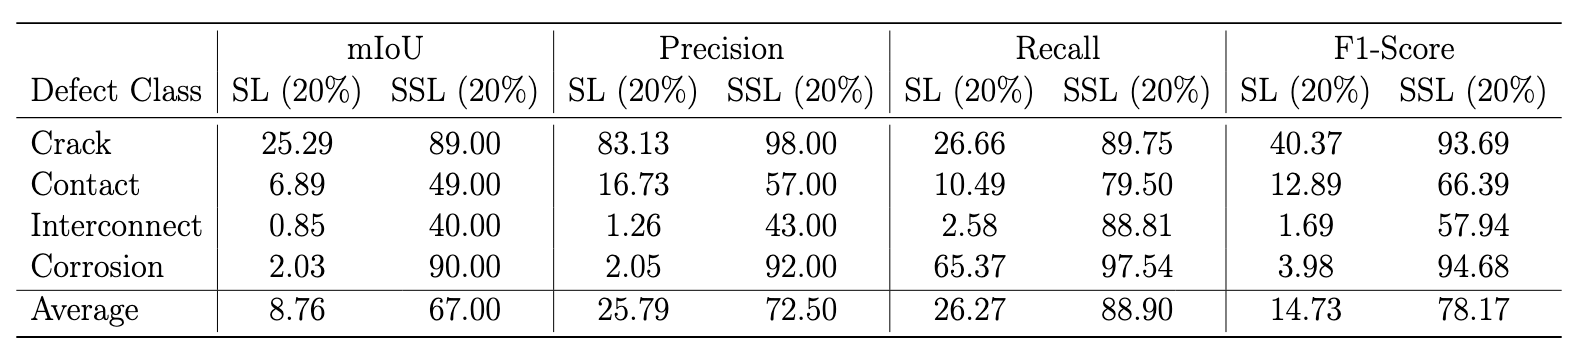
The table shows the performance of different defect classes under Supervised Learning (SL) with 20% labeled images and Semi-Supervised Learning (SSL) with 20% labeled images. The metrics evaluated include IoU, Precision, Recall, and F1-Score, facilitating a direct comparison of the impact of labeling extent on model performance.
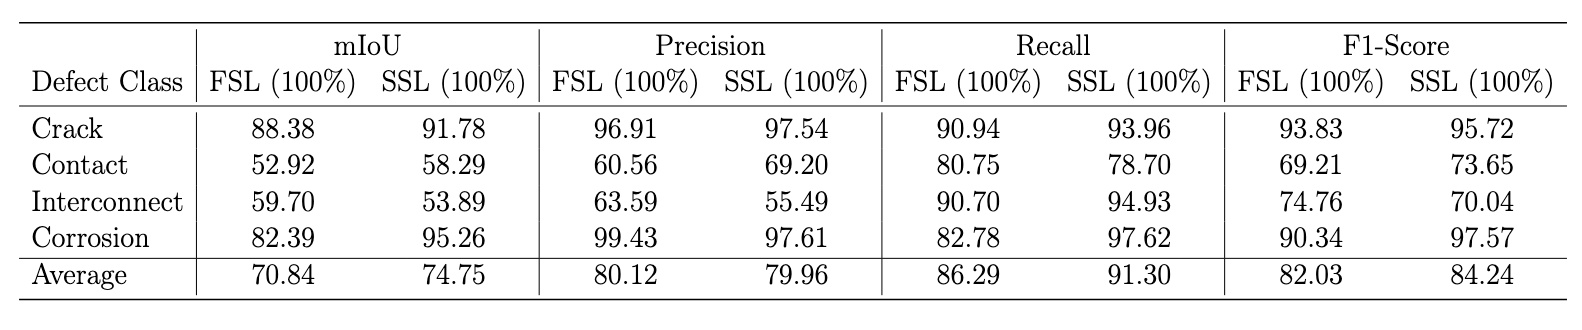
The table shows the performance of different defect classes under Semi Supervised Learning (SSL) with 100% labeled images, and Fully Supervised Learning (FSL) with 100% labeled images. The metrics evaluated include mIoU, Precision, Recall, and F1-Score, facilitating a direct comparison of the impact of labeling extent on model performance.
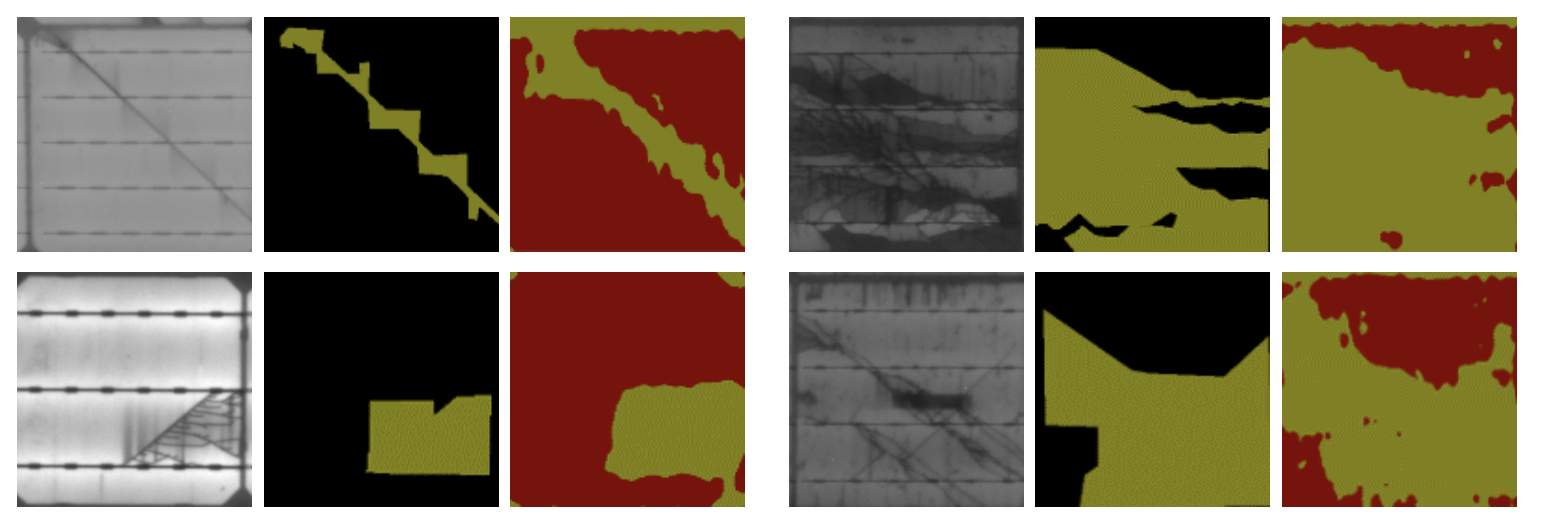
Here we show visual analysis of the results obtained by PV-S3 for various defect categories. In each set of three images, the first image shows EL image, the second image is the ground-truth segmentation for corresponding defect and the third image shows the segmentation provided by PV-S3.
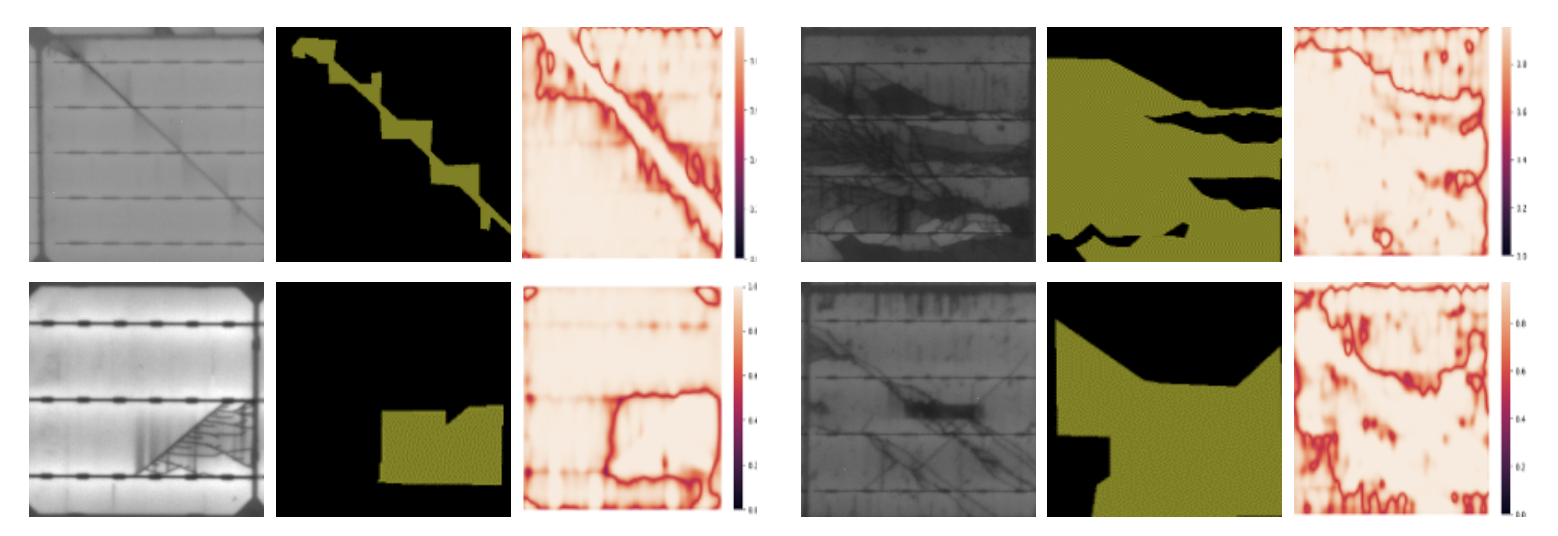
Here we analyse the confidence of PV-S3 for defect segmentation and observe a lower confidence in boundary regions of detected defects. In each set of three images, the first image is the EL image, the second image shows ground-truth segmentation mask, and the third image shows confidence of models prediction.
BibTeX
@article{jha2025advancing,
  title={Advancing automatic photovoltaic defect detection using semi-supervised semantic segmentation of electroluminescence images},
  author={Jha, Abhishek and Rawat, Yogesh and Vyas, Shruti},
  journal={Engineering Applications of Artificial Intelligence},
  volume={160},
  pages={111790},
  year={2025},
  publisher={Elsevier}
}